
The core principle of an evidence-based approach is that risk and return are related. The remaining principles of the evidence based approach flow from this core principle. In this second installment in our series on Evidence-Based Investing we present some of the evidence which demonstrates that over time a buy and hold “passive” investment strategy will outperform an “active” strategy that tries to beat the market by picking superior securities or to time the market’s ups and downs.
“Most investors, both institutional and individual, will find that the best way to own common stocks (shares) is through an index fund that charges minimal fees. Those following this path are sure to beat the net results (after fees and expenses) of the great majority of investment professionals.”
— Warren Buffet in his 1996 annual report to Berkshire Hathaway shareholders
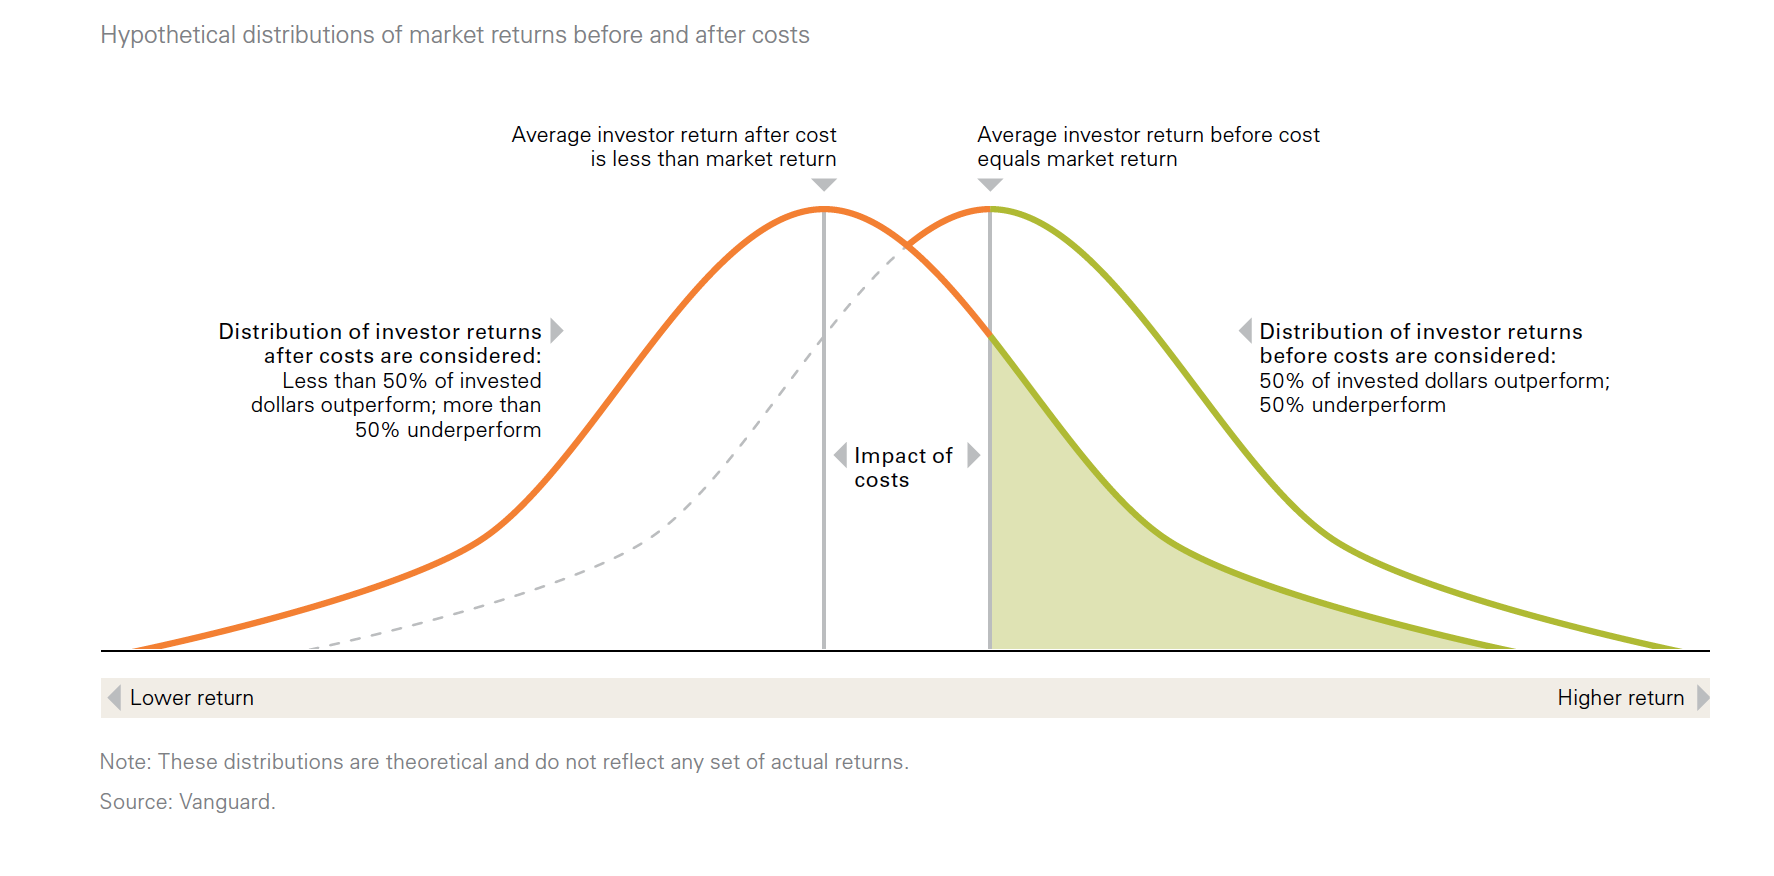
The evidence is clear. Active investing (trying to beat the market by picking stocks or by timing market ups and downs) underperforms passive investing (buying and holding the market) over the long run. The charts below present evidence based on historical performance data but let’s first examine the logic. The diagram below from Vanguard Investments Canada Inc. (Vanguard) shows two hypothetical return distributions – think of a distribution as a plot of every different investor’s actual return over a given year or series of years. Some will outperform the market, some will underperform the market. Very few will do really poorly or really well and most will have returns somewhere around the average. The curve on the right shows the pattern of results before taking any costs into account. If you assume that you have to pay someone to manage your investments the whole curve shifts to the left by precisely the amount of the costs. If all investors together earn the average market return, the average actively managed stock fund has to underperform the market by the average amount they charge investors. According to Morningstar, in Canada the average annual asset weighted expense ratio paid by investors for a stock fund as of December 2013 was about 2.25%, one of the highest expense ratios in the world.
So how can investors improve on this result? They either have to find a stock broker or fund manager who can outperform the average or they have to lower their costs by finding a cheaper active manager or by investing in a low cost passive fund that seeks to deliver the average market return with a high degree of certainty. The evidence shows that the track record of active fund managers trying to beat the market by picking better stocks or timing the ups and downs of the market is poor.
William Sharpe, Nobel Laureate in Economics and one of the world’s leading authorities and publishers on the subject summarized the evidence in his Financial Analysts’ Journal Article – The Arithmetic of Active Management as follows: “Properly measured, the average actively managed dollar must underperform the average passively managed dollar, net of costs. Empirical analyses that appear to refute this principle are guilty of improper measurement.”
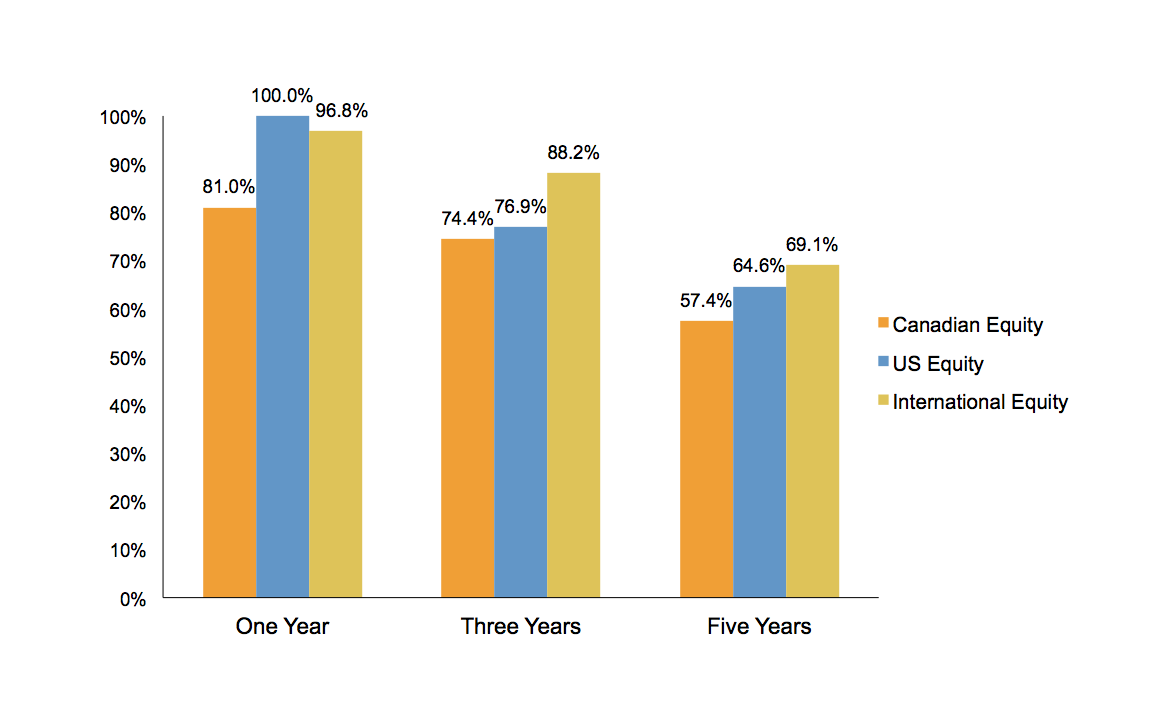
Many studies that show the performance of active fund managers just look at the population of current fund managers and calculate their performance track record over a defined period of time, say five or ten years. This approach doesn’t take into account fund managers that failed to survive the period under examination. The chart below (data from the Standard & Poor’s Indices Versus Active Funds Canada Scorecard, Year-End 2013 and chart from DFA) presents the evidence. It shows the survival rates for Canadian, US and International equity funds over one, three and five year periods ending December 31, 2013. Just over 57% of Canadian equity funds survived the five year period.
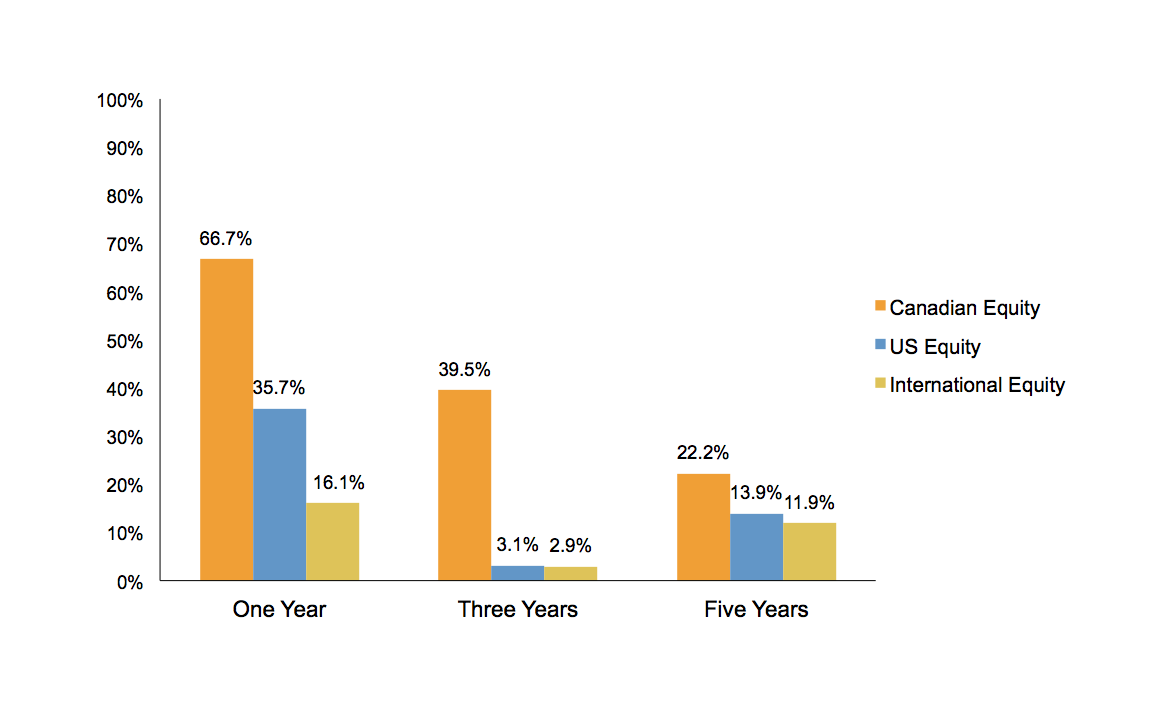
We believe it’s a reasonable assumption that those that didn’t survive weren’t performing very well. The next chart from the same source shows the percentage of funds that both survived and outperformed their benchmark indices over the same one, three and five year periods.
Outperforming fund managers seem difficult to find. The data shown above is not secret. It is in fact widely available and we imagine lamented by the investment industry. However you won’t hear it from them. In our many years of working with hundreds of institutional fund managers around the world, it was quite rare to see a marketing presentation that showed chronic underperformance.
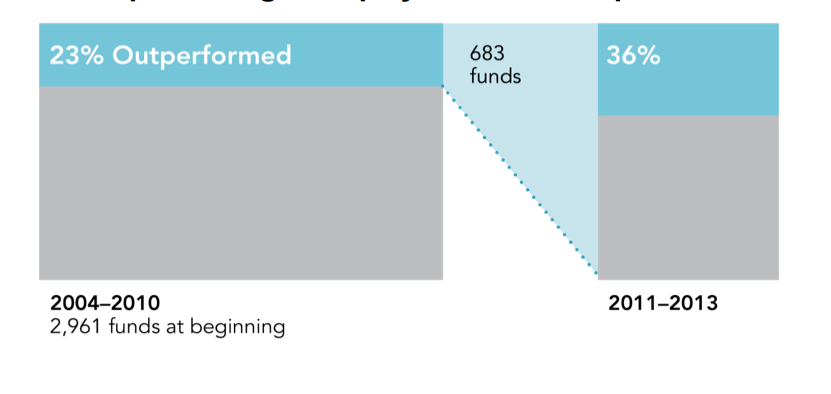
So what about the winners? The evidence shows that picking future winners based on past performance doesn’t work either. The chart below (from DFA’s 2014 The Mutual Fund Landscape) looks at US equity funds over a ten year period. After six years only 23% of the funds survived and outperformed. Looking only at those outperformers, only 36% of them outperformed over the next three years. Predicting winners based on past outperformance is difficult.
Nonetheless there are still winners. The problem is, like with guessing how many jellybeans there are in a jar (see Part One), it is very difficult to differentiate between luck and skill.
In his great book, “Fooled by Randomness,” Nassim Nicholas Taleb tries to help us put the winners in perspective by taking the reader through a simple scenario: “Toss a coin; heads and the manager will make $10,000 over the year, tails and he will lose $10,000. We run the contest for the first year for 10,000 managers. At the end of the year, we expect 5,000 managers to be up $10,000 each, and 5,000 to be down $10,000. Now we run the game a second year. Again, we can expect 2,500 managers to be up two years in a row; another year, 1,250; a fourth one, 625; a fifth, 313. We have now, simply in a fair game, 313 managers who made money for five years in a row… Out of pure luck… a population entirely composed of bad managers will produce a small amount of great track records… In other words, the number of managers with great track records in a given market depends far more on the number of people who started in the investment business (in place of going to dental school), rather than on their ability to produce profits.”
The challenge, of course, is that the winners, even if only in the spotlight due to pure luck, tend to have the loudest voice and tend to write the most glorious stories and books about how their method is the best, how they have the secret sauce. The financial media tends to amplify these stories.
Like Warren Buffet says, it’s not worth paying someone to try to beat the market.
Please visit again for the next installment of Evidence-Based Investing where we will discuss the next principle: Investment Portfolios Should Be Diversified.