
The core principle of an evidence-based approach is that risk and return are related. The remaining principles of the evidence based approach flow from this core principle. In the third installment of our series on Evidence-Based Investing we presented some of the evidence which demonstrates that investors should diversify their investment holdings. In this fourth installment we focus on asset allocation.
Determining the correct asset allocation is one of the most important decisions to be made when establishing an investment strategy. Your asset allocation is the proportion of your investment portfolio that will be invested in each asset class. The asset allocation is the best way to adjust the level of risk you take and to target an appropriate expected rate of return. The diagram below (from Vanguard) illustrates this principle. It presents different allocations between Canadian stocks and bonds and the annual average and range of returns between 1985 and 2013 for each combined portfolio. Choosing a mix of stocks and bonds along a continuum, such as the one in the illustration, allows you to pick a specific expected risk/return profile. Note that this chart does not include the benefits of diversifying with stocks outside of Canada. As a result, at a certain point the average return of the portfolios doesn’t change that much as the asset mix is tilted more towards stocks while the risk increases (the range of outcomes gets wider). Diversifying globally would improve the return/risk profile of the portfolios weighted more towards stocks.

It is important to note that the relative mix of stocks and bonds in the portfolio should be determined by your own unique appetite or tolerance for risk. (Your risk tolerance is based on three elements – your (1) willingness, (2) ability and (3) need to take risk). It should not be made according to how well you believe stocks or bonds will perform in the near future. As we observed earlier in Part Two of our blog series on evidence based investing, the evidence demonstrates that it is nearly impossible to time the markets. Furthermore the allocation of stocks and bonds to different regions or other risk factors should also be done based on your risk profile and diversification needs rather than on any assessment of which specific groups of stocks or bonds are likely to outperform in the future.
Once the original asset allocation has been set and becomes part of your investment policy, the next challenge is to stay disciplined. Trading should only be done to rebalance your portfolio back to your original asset allocation when it goes off by a predetermined amount. This discipline forces you to buy more of an asset when prices have fallen and sell more of an asset when prices have gone up in order to get your allocation back into balance. In many cases it will be difficult to stick to your discipline because people are generally hard wired to do the opposite of what makes investing sense. Generally money flows into stock funds after a period of strong stock performance and out of stock funds after periods of weak performance. This is because people feel good about stocks when they’re doing well. However, markets often move up and down at random and people end up chasing market performance when it is too late, with the ultimate result being significant underperformance relative to basic market indices. Good advisors keep investors disciplined and keep them invested at the right level rather than trying to outsmart the market. Staying the course takes emotional fortitude and experience. Not being disciplined and chasing market performance is a large reason why many investors have a poor track record, even relative to the funds where they invest their money. The following chart from Vanguard illustrates that the net flow of cash into Canadian equity funds trails the actual performance of the market.
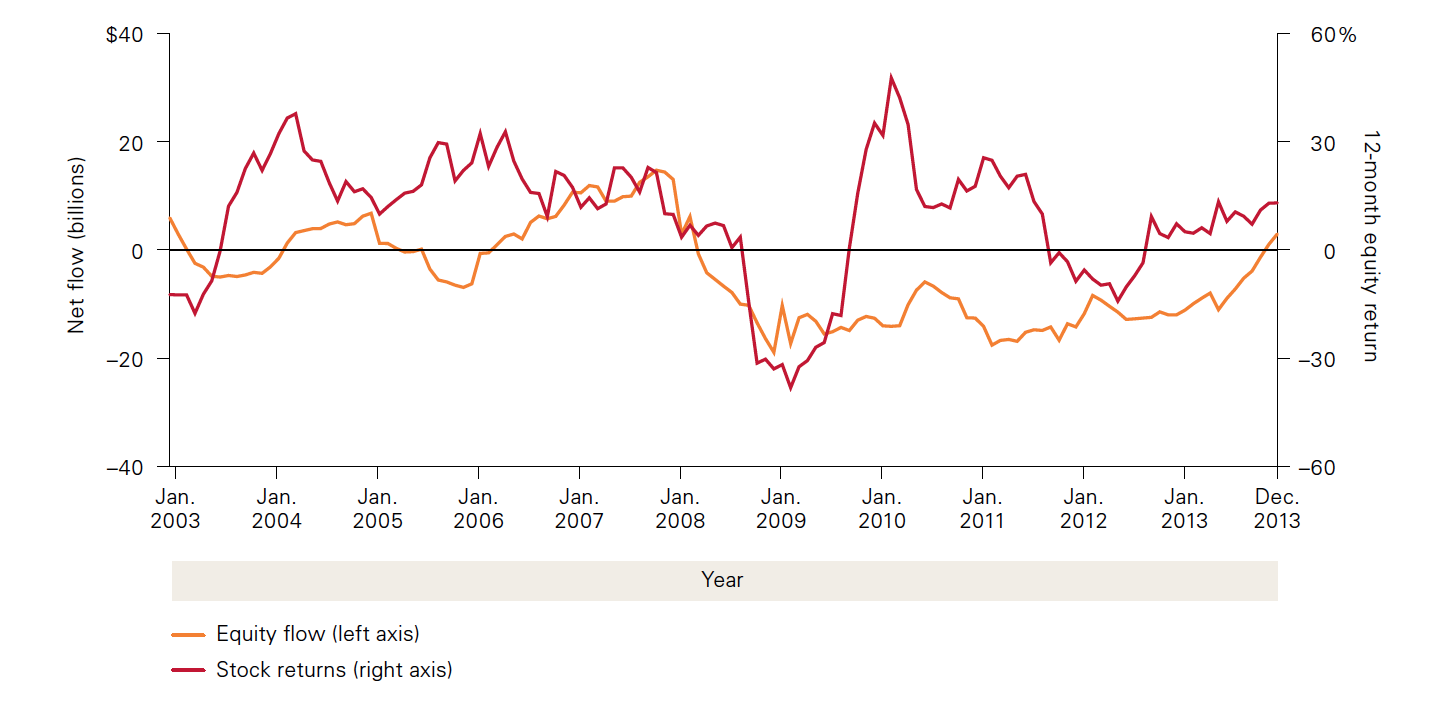
Many investors took their money out of equities immediately following the market crash in 2008/2009 thereby missing the strong rebound in the markets that followed.
The chart below is from Vanguard using data from Thompson Reuters Datastream. A simple discipline of semi-annually rebalancing a portfolio of 60% Canadian stocks and 40% Canadian bonds over the 10 years through 2013 would have yielded much higher returns than if the investor had sold out of stocks on January 1, 2009 in the middle of the financial crisis.

The emotional and reactive response pattern illustrated in the picture below is totally understandable.

However, while understandable, falling victim to this reactive emotional cycle will most certainly lead to underperformance. The cycle can be avoided by employing an allocation strategy based on risk tolerance and strict rebalancing. This is very difficult for individual investors with limited investment experience to manage on their own. Helping investors to not fall victim to this cycle is an area where a good advisor can add significant value.
While trying to time the market, avoiding the lows and catching the highs, is alluring, in practice it is extremely difficult and very costly if it doesn’t work. The chart below illustrates that in many cases a large proportion of market returns are captured in a small number of trading days. Trying to guess when these days will occur is very difficult and missing them can lead to significant underperformance. Staying invested in the market in a disciplined way means you will capture the best of market returns every time they occur. The diagram below from DFA illustrates the impact of missing out on the best days of the market over a long period of time. Just by missing the 25 best days of returns of the S&P/TSX Composite Index between 1977 and 2013 you would have experienced dramatically lower investment returns.

Please visit again for the next installment of Evidence-Based Investing where we will discuss the final principle: Minimize Costs And Taxes.